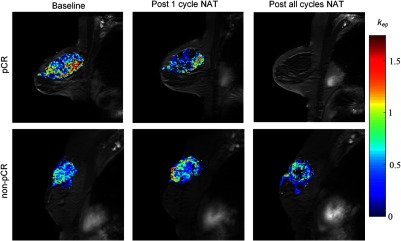
Fig. 2.
An example of quantitative analysis of DCE-MRI data of a patient achieving pCR (top row) and a patient not achieving pCR (bottom row) before (first column), after the first cycle (second column), and at conclusion of all NAT (third column). The parametric map of overlaid on a high resolution anatomical MRI scan is shown. Note the diminution of exhibited in the patient achieving pCR after one cycle of NAT, but the enhanced in the patient not achieving pCR.

