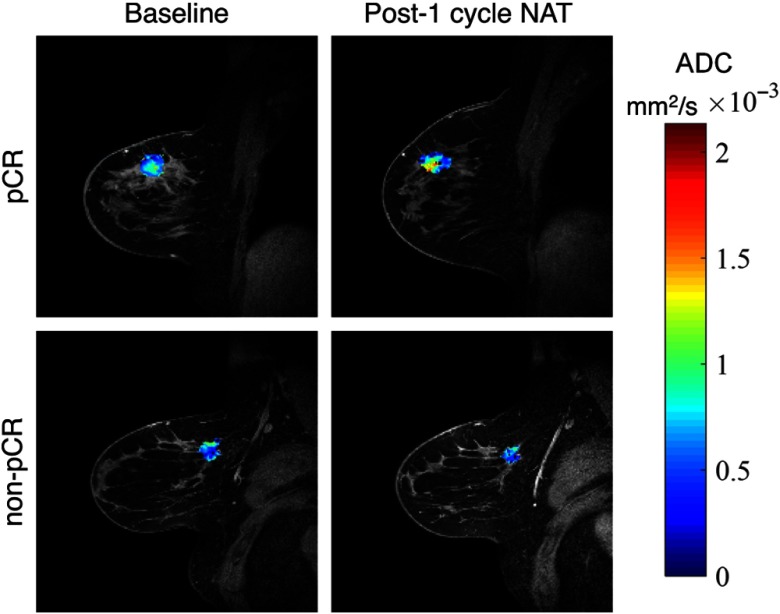
Fig. 3.
An example of DW-MRI data from a patient achieving pCR (top row) and a patient not achieving pCR (bottom row). ADC maps from the tumor region are overlaid on a high resolution anatomical image before (left column) and after the first cycle of NAT (right column). The patient who ultimately achieved pCR exhibits increased at ADC early time points within therapy, whereas the patient who did not achieve pCR does not.

