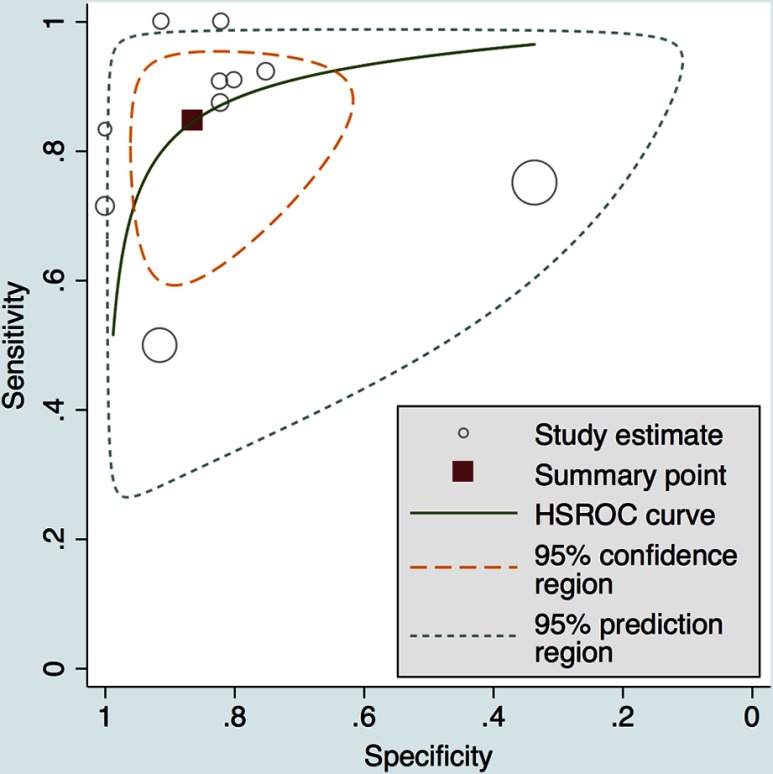
Fig. 5.
The HSROC curve displays test performance of individual studies as well as the pooled average estimate. The summary operating point and large area under the curve demonstrate that DCE- and DW-MRI can achieve high sensitivity and specificity for predicting pCR in the neoadjuvant setting for breast cancer. The width of the confidence contour demonstrates the high amount of heterogeneity present in the included selection of studies. Each circle represents a study and the size of the circle refers to the size of the study.

