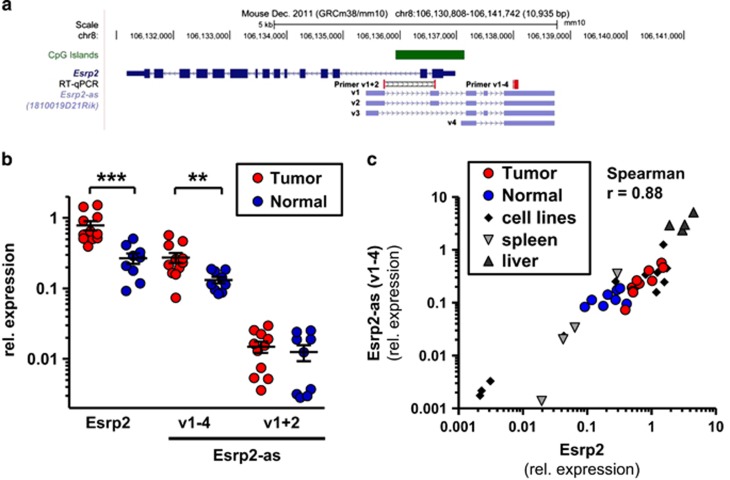
Figure 2.
Esrp2 and Esrp2-as are coordinately overexpressed in C3(1) mammary gland tumors. (a) Genomic organization of Esrp2 (dark blue) and Esrp2-as variants 1-4 (v1-4, light blue). Location of primers detecting Esrp2-as v1+2 or v1-4, respectively, is indicated in red. (b) Relative expression levels as determined by RT–qPCR are significantly different between tumor (n=11) and normal samples (n=9) for Esrp2 and Esrp2-as (v1-4), but not for Esrp2-as (v1+2). Samples were derived from animals aged 20-24 weeks, and expression levels were normalized to three reference genes (Hprt1, Tbp, β-Actin). Mann-Whitney U test, **P<0.01, ***P<0.001. (c) Esrp2 and Esrp2-as v1-4 expression assessed by RT–qPCR highly correlates in tumors, normal mammary gland, cell lines, spleen, and liver samples. Spearman’s rank correlation coefficient rho=0.88 (P <0.0001).

