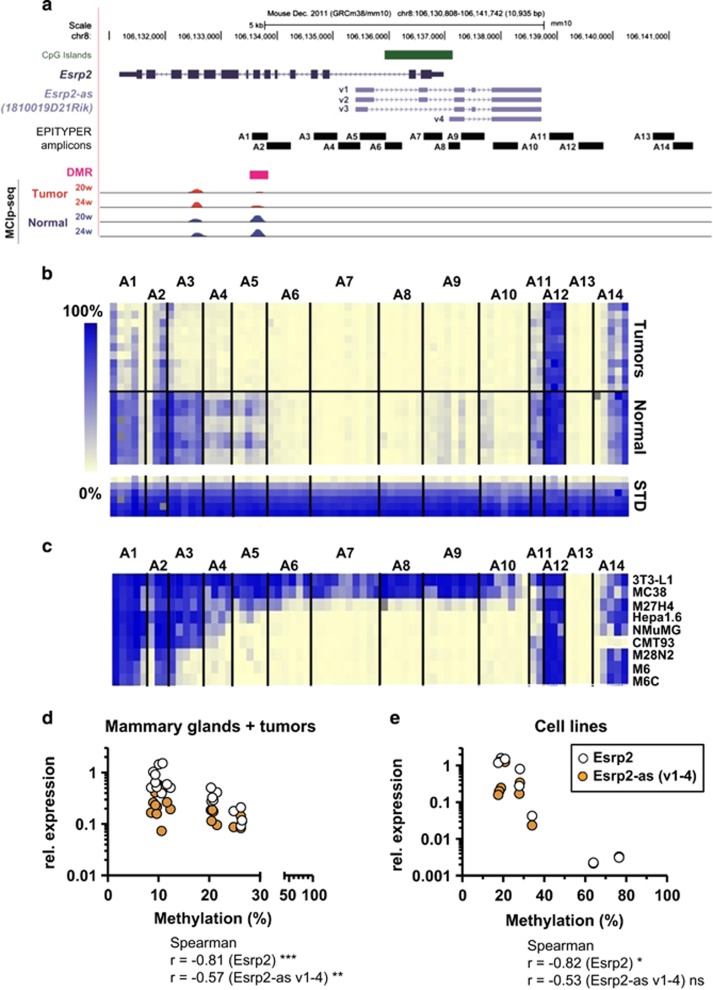
Figure 3.
DNA methylation levels inversely correlate with expression levels of Esrp2 and Esrp2-as. (a) Upper: genomic organization of Esrp2 (dark blue) and Esrp2-as variants 1-4 (v1-4, light blue) and the CGI overlapping the Esrp2 TSS (green). Positions of EPITYPER Amplicons A1-A14 are indicated by horizontal black bars, covering the DMR (pink), the CGI, and CGI shores on both sides. Lower: MCIp-seq detection of methylated DNA fragments in tumors (red) and normal WT mammary glands (blue) of animals at 20 and 24 weeks of age. Each lane represents average reads obtained for three individual samples. (b,c) Heatmap of DNA methylation levels in tumor samples (n=11) and normal mammary gland tissue (n=9) (b), or of various murine cell lines (c), with each row representing one individual sample and each column one CpG unit comprising of 1 to 4 individual CpG sites. Methylation levels are depicted by a color-coded gradient from 0% (light yellow) to 100% methylation (blue). Gray squares indicate failed measurements. (d,e) Correlation between average methylation of amplicons A1-A14 and Esrp2/Esrp2-as expression levels normalized to three reference genes, calculated by Spearman’s rank correlation for tumor/normal tissues (d) and cell lines (e). *P <0.05, **P<0.01, ***P<0.001.

