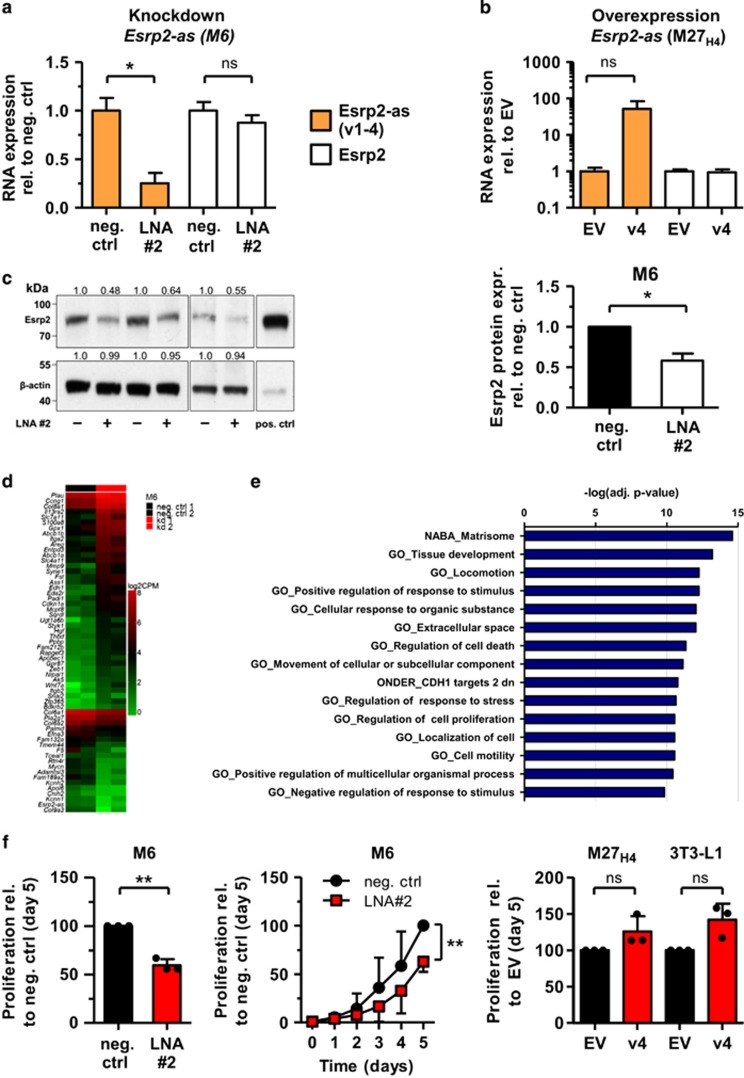
Figure 5.
Knockdown of Esrp2-as reduces Esrp2 protein levels, globally alters expression of genes involved in cellular motility and inhibits cell proliferation. (a) Knockdown of Esrp2-as by Locked Nucleic Acid antisense Gapmers (LNAs) in the M6 cell line for 72 h. Expression levels were assessed by RNA-seq; CPM values are normalized to cells transfected with negative control LNA. Mean±SD of two independent experiments. Statistical significance was assessed using Student’s t-test with *P <0.05. (b) M27H4 cells were transiently transfected with constructs containing Esrp2-as v4. Expression levels 72 h post-transfection were assessed by RNA-seq; CPM values are normalized to cells transfected with the empty vector (EV). Mean±s.d. of three independent experiments. Statistical significance was assessed using Student’s t-test with Welch’s correction (P =0.116, NS). (c) Esrp2 protein expression in the M6 cell line 72 h after knockdown of Esrp2-as with LNA#2. M27H4 cells stably overexpressing Esrp2 were used as a positive control (pos. ctrl). Band intensities were normalized to β-actin levels and are semi-quantitatively evaluated relative to the negative control using TINA v2.09. Depicted is the mean±SD of three independent experiments. Statistical significance was assessed using a one-sample t-test with the neg. control set to 1.0, with *P <0.05. (d) Heatmap of top 40 up- and top 20 downregulated genes after Esrp2-as knockdown in M6 cells. Depicted are log2 CPM values of two biological replicates. (e) Overlap of differentially expressed genes after knockdown of Esrp2-as with gene sets in MSigDB using GSEA.35 (f) Cell proliferation was assessed by SRB staining on five consecutive days starting 24 h post transfection (day 0). Cell proliferation was adjusted for the number of seeded cells and is depicted in relation to the negative control or EV at day 5 (set as 100%). Shown is the mean±SD of three independent experiments (represented by black dots). Statistical significance was assessed using the one-sample t-test with **P<0.01, NS, not significant.

