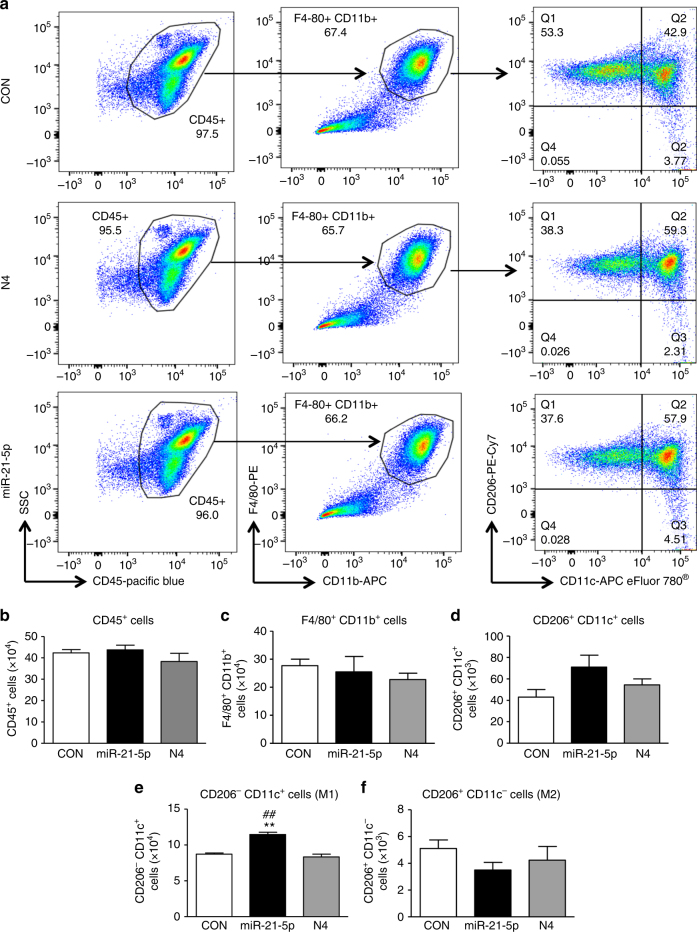
Fig. 7.
Transfection of peritoneal macrophages with miR-21-5p mimic reduces M2 and favors M1 phenotype. a Representative scatterplots of peritoneal macrophages transfected with N4 or miR-21-5p mimc for 48 h. Cells were immunolabeled with antibody–fluorophore conjugates against CD45, CD11b, F4/80, CD206, and CD11c. Macrophages were defined as CD45+CD11b+F4/80+ cells, and their fluorescence intensity for CD206 and CD11c labels were used to define M1 (CD206−CD11c+) and M2 (CD206+CD11c−) phenotypes. Numbers in gates refer to percentage of positive cells for each specific marker. b–f Bar charts represent numbers of leukocytes (CD45+ cells), macrophages (CD11b+F4/80+) and (CD206+CD11c+), M1 macrophages (CD206−CD11c+) and M2 macrophages (CD206+CD11c−). Data are means ± S.E.M., n = 4 for each group. **P < 0.01 compared to CON; ## P < 0.01 compared to N4, one-way ANOVA, post hoc Bonferroni

