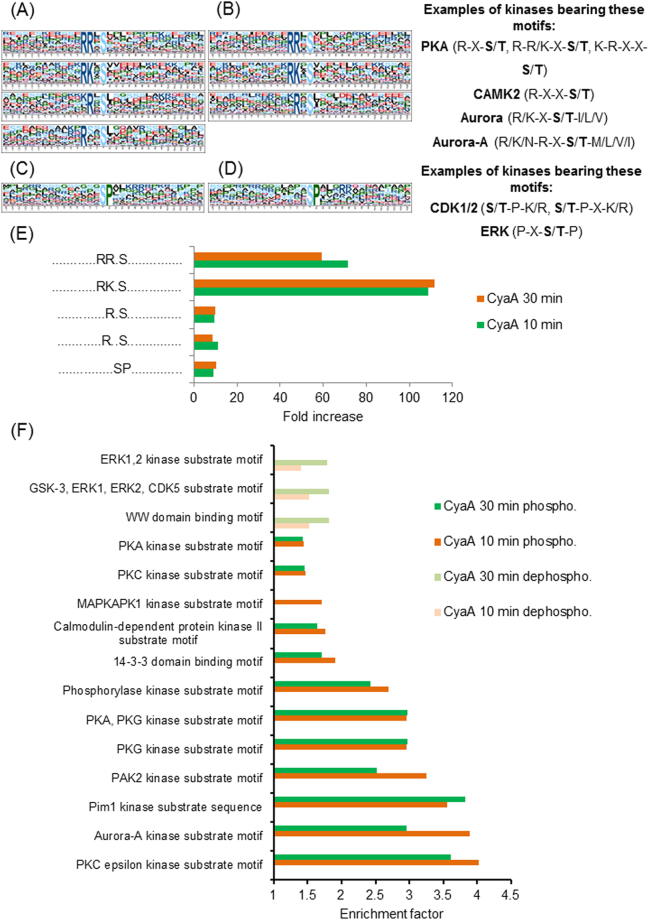
Figure 1.
Kinase enrichment analysis of significantly regulated phosphosites. Significantly regulated phosphosites in all replicates for the given experimental condition were identified by Global Mean Rank Test as described in Supplementary Methods. The kinase motifs were next extracted with the web-based motif-x (http://motif-x.med.harvard.edu/) application (Chou & Schwartz, Curr Protoc Bioinformatics. 2011) and assigned to characterized kinases using the PHOSIDA database (http://141.61.102.18/phosida/home.aspx) with the IPI mouse proteome data background (ftp://ftp.ebi.ac.uk/pub/databases/IPI), using a significance threshold of 0.000001 and a minimal occurrence value of the motif set to 20. (A) Overrepresented phosphosite motifs extracted as upregulated (phosphorylated) phosphosites by motif-x for samples incubated with CyaA for 10 or (B) 30 minutes. Occurrence value of the “..R..S..” motif was 19, hence, just below the set threshold of 20. (C) Overrepresented motifs extracted as downregulated (dephosphorylated) phosphosites by motif-x for samples incubated with CyaA for 10 or (D) 30 minutes. The “..SP…R..” motif found in the samples treated with CyaA for 30 min exhibited an occurrence number of 19, hence, below the threshold of 20. (E) Fold increase of extracted motifs shown in (A) and (B). Fold increase was calculated as the ratio (foreground matches divided by foreground size) divided by (background matches divided by background size), where the background is the predefined organism background from IPI Mouse Proteome. (F) Prediction of kinase-specific phosphorylation sites found among the significantly differentially regulated (both phosphorylated and dephosphorylated) phosphosites in samples treated with CyaA (with localization probability > 0.75 in all replicates in 10 and 30 min samples), compared to buffer-treated controls, by Fisher exact test (Benjamini-Hochberg FDR with the threshold value 0.05). Results are expressed as enrichment factors that are counted using the following formula: (number of hits for particular kinase divided by the number of significantly regulated phosphosites) divided by (number of hits of the particular kinase in the whole given cluster divided by the total size of the dataset). Only kinase enrichment factors > 1 are depicted. Perseus software package for shotgun proteomics data analyzes, version 1.5.1.6, was used for the analysis, employing the Human Protein Reference Database (Release 9).

