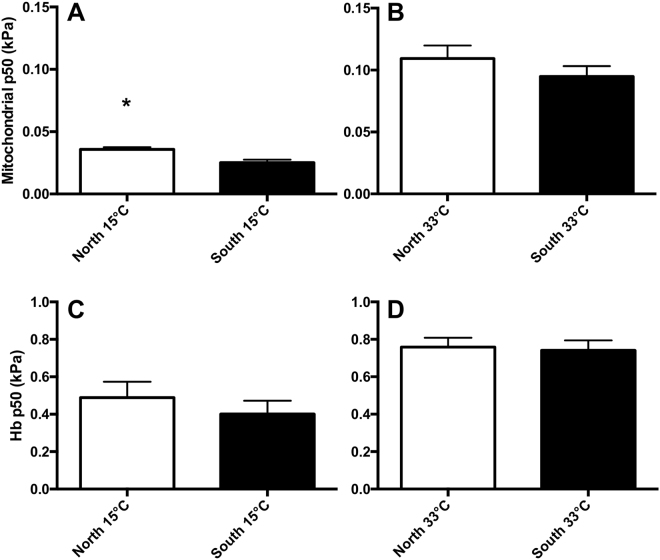
Figure 2.
Intraspecific differences in mitochondrial. (A,B; n = 7–8) and hemoglobin (C,D; n = 7–20) O2 binding affinity. Northern and southern Fundulus heteroclitus were acclimated to 15 (A,C) or 33 °C (B,D). The assay temperature for subspecies comparisons was the same as acclimation temperature (e.g., 33 °C acclimated fish were compared at Tassay = 33 °C). Asterisks indicate a significant subspecies effect within an acclimation treatment (T-test, p < 0.05). Data are mean ± SEM.

