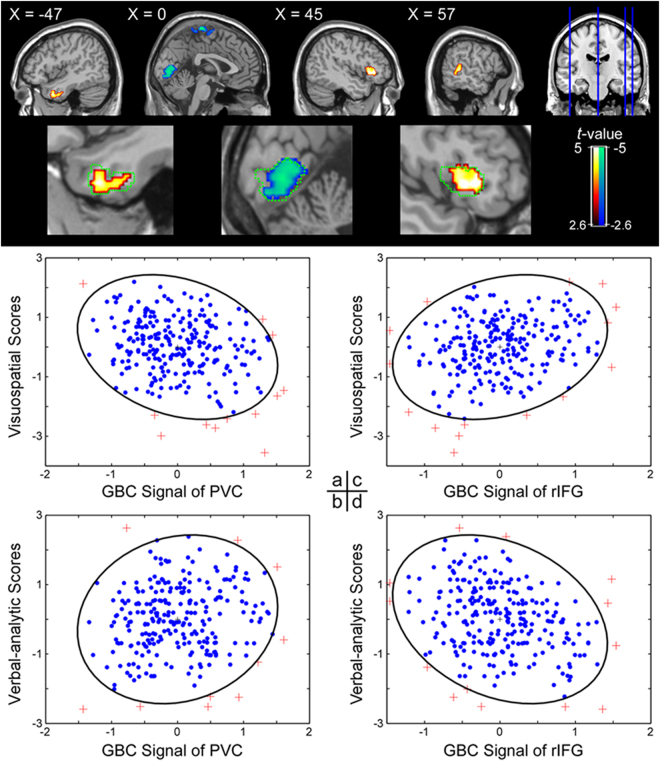
Figure 5.
The upper panel depicts the interaction regions between visuospatial and verbal-analytic reasoning. Clusters containing more than 116 contiguous voxels survived the AlphaSim correction. The green dotted line shows the brain-behavioral GBC correlation regions of visuospatial and verbal-analytic reasoning; these correlation regions partially overlap; that is, they show a significant brain-behavioral correlation and, at the same time, a significant interaction of visuospatial and verbal-analytic reasoning. The bottom panel depicts correlational patterns between: (a) the primary visual cortex’s (PVC) GBC value and the visuospatial subset score; (b) the PVC’s GBC value and the verbal–analytic subset score; (c) the right inferior frontal gyrus’s (rIFG) GBC value and the visuospatial subset score; and (d) the rIFG’s GBC value and the verbal–analytic subset score. These visuospatial and verbal-analytic reasoning scores were centered using z-transform. The elliptic boundary defines the 95% confidence region.

