Figure 5.

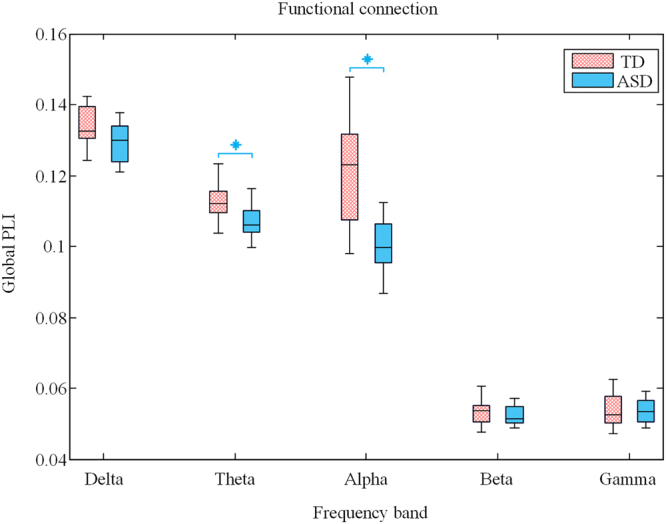
Mean PLI averaged over all pairs of EEG channels for TD (red) and ASD (blue) in five frequency band. Significant difference between TD and ASD with t-test (p < 0.01) are presented by blue asterisks (Bonferroni correction).

Mean PLI averaged over all pairs of EEG channels for TD (red) and ASD (blue) in five frequency band. Significant difference between TD and ASD with t-test (p < 0.01) are presented by blue asterisks (Bonferroni correction).