Fig. 2.
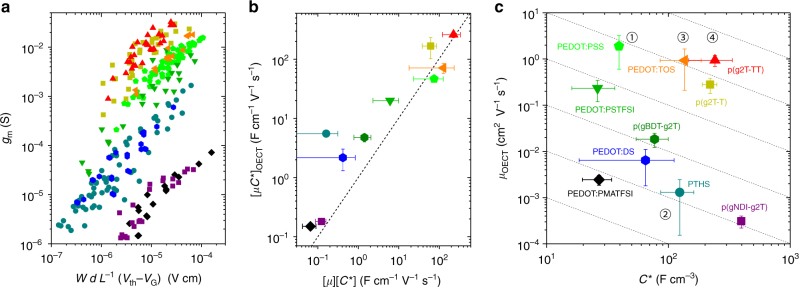
µC* as the OECT figure of merit. a Transconductance (g m) of OECTs as a function operating conditions (in saturation regime) and channel geometry. Each point represents one OECT measurement; each color/shape represent one material, as indicated in the labeling in c. b The linear slope of the data in a, [µC*]OECT, as a function of the product of µ OECT and C* determined independently, [µ][C*]. The dashed line represents 1:1 agreement between the values. Error bars represent the propogation of errors from the product of µ and C* for which the standard deviation is determined over all devices tested for each material, as well as the error in the linear fit of data from each material in a. The color coding and shape for each material is as noted in c. c µ OECT−C* map of ten previously reported materials. Dotted lines denote constant µC* product. Circled numbers in c refer to the discussion in text

