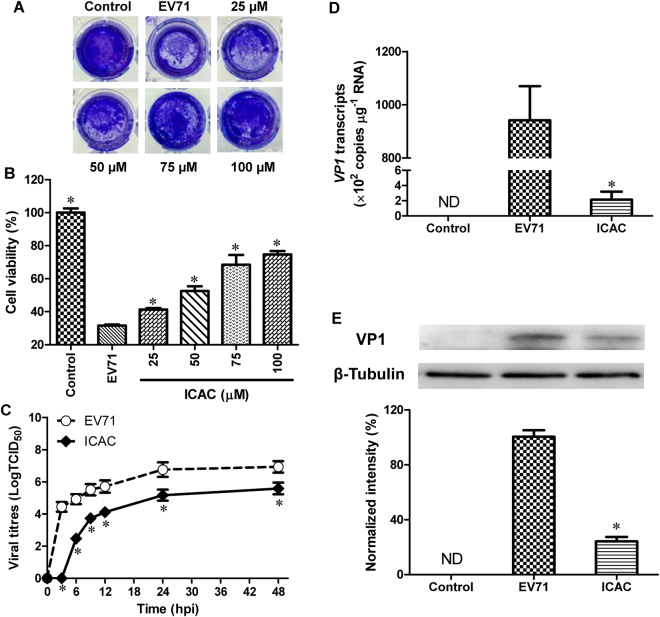
Figure 2.
The antiviral effects of IACA against EV71 in Vero cells. Vero cells were infected with 100 TCID50 of EV71 with or without different ICAC concentrations as indicated. Uninfected cells were used as the control group. (A) ICAC blocked the CPE of EV71 infection. (B) Cell viability was detected using the MTS cell proliferation assay kit at 48 hpi. The viability of the control group was set as 100% (n = 6). (C) The virions were collected by freeze-thawing at the indicated time points. The supernatant was harvested for the viral titre assay. (D) The RNA load was determined using a real-time PCR kit specific for the VP1 gene. (E) Protein samples normalized to 40 µg were subjected to 12.5% SDS-PAGE and then transferred to PVDF membrane to detect the EV71 VP1 protein expression levels. The amount of β-Tubulin was used as the internal standard. The VP1 band intensity was analysed and normalized to the corresponding band intensity of β-Tubulin. The band intensity of the EV71 group was set as 100% (n = 3). All results were expressed as the means ± SEs. Asterisks indicate that the data significantly differ from the EV71 group at the P < 0.05 level according to one-way analysis of variance.

