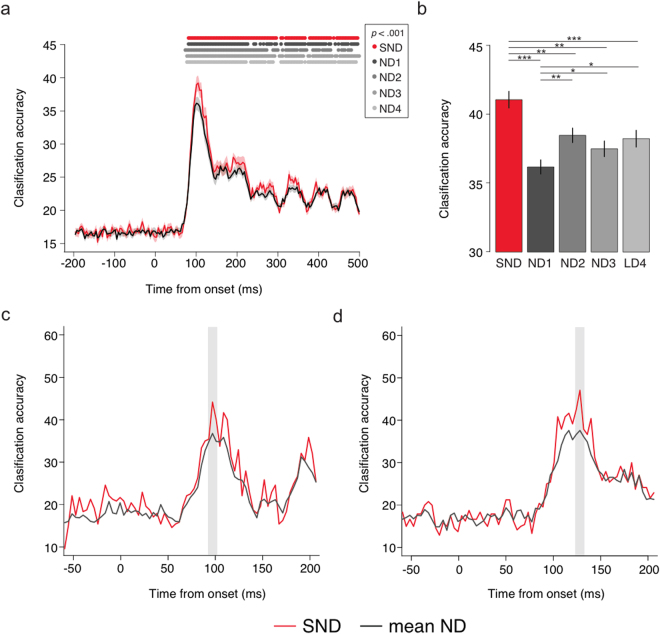
Figure 2.
Decoding results. (a) Mean accuracy for 6-way classification, performed for each time point for the SND and mean of ND electrode arrays. Shaded area depicts standard error of the mean corrected for within subjects designs29. Dots depict time points with significant group-wise decoding per array, p < 0.001. (b) Mean decoding accuracy per electrode array, 10 ms around each individual’s first peak in decoding. SND outperformed all ND arrays. (c) Example decoding trace for one participant, with peak at 92–102 ms. (d) Example decoding trace for one participant, with peak at 123–133 ms.

