Fig. 2.
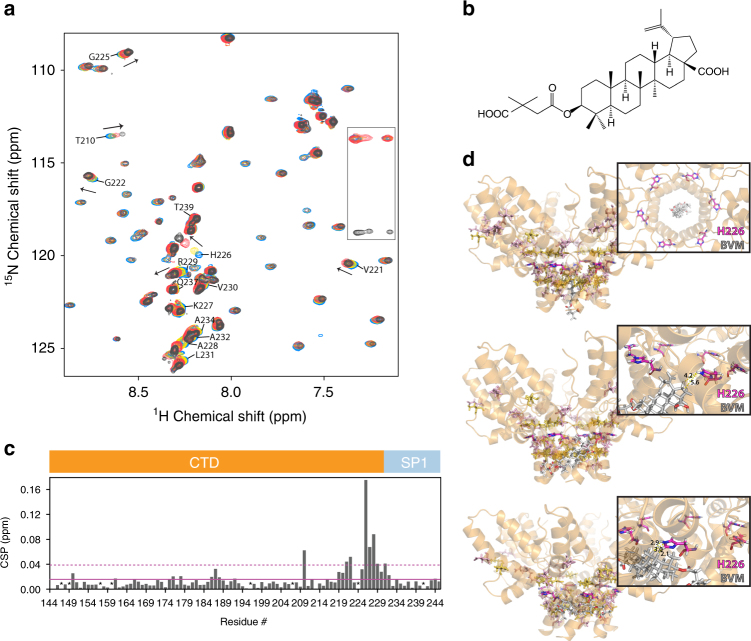
Solution NMR and rigid body docking of Bevirimat binding to CTD–SP1. a Superposition of selected region of the 1H-15N HSQC spectra of 0.4 mM CTD–SP1 in the absence (blue) and presence of 1.11 mM (yellow), 2.22 mM (red), and 3.33 mM (black) Bevirimat at 298 K. Representative CTD–SP1 resonances are labeled with residue names and numbers. Folded arginine side chain Nε resonances are enclosed in the rectangle. b 1H,15N-combined chemical shift perturbations (CSP) for CTD–SP1 resonances in the absence and presence of Bevirimat (3.33 mM), respectively. The solid and dashed horizontal lines indicate the average chemical shift change (0.016 ppm) and the sum (0.038 ppm) of the average change plus one S.D., respectively. Proline residues and the unassigned S149 positions are marked with *. Note the large CSPs observed for resonances of residues 219–233 are indicative of the interaction between Bevirimat and CTD–SP1. c Chemical structure of Bevirimat. d Binding poses of BVM (gray) in the CTD–SP1 hexamer (X-ray structure PDB code 5I4T) resulting from rigid body docking. The insets are expansions, illustrating the relative positioning of BVM and the H226 residue (colored magenta). Residues with CSPs > 0.04 and >0.02 ppm are colored yellow and light pink, respectively. Residues in the CTD–SP1 junction whose resonances experience CSPs > 0.02 ppm are located in the binding interface identified in the docking studies

