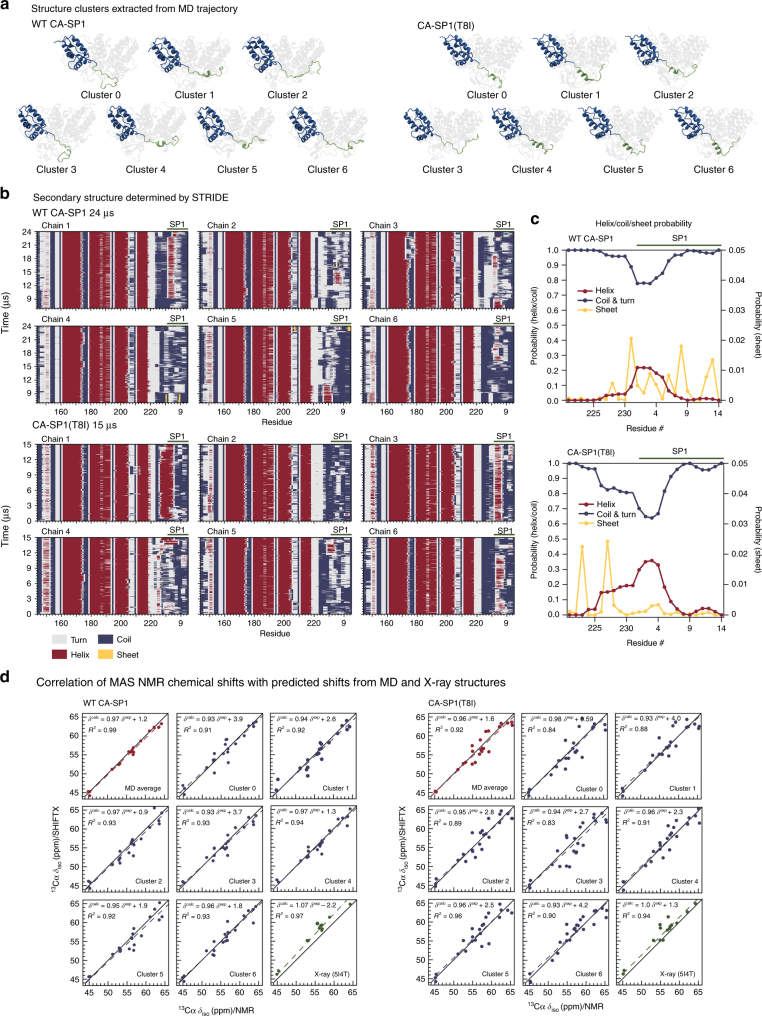
Fig. 4.
MD simulations of the CTD–SP1 hexamer. a Clustering analysis of the MD trajectory of CA–SP1 WT (left) and CA–SP1(T8I) mutant (right) identified six major sub-populations. One chain is colored in blue (CA–CTD) and green (SP1) to illustrate the differences in secondary structure present in the SP1 region: predominantly random coil in CA–SP1 WT and significantly increased helical content in CA–SP1(T8I). b Stride plots of secondary structure for each chain along with the MD trajectories for CA CTD–SP1 WT (top), and CA CTD–SP1(T8I) mutant (bottom). c Helix/coil probability of the CTD tail (V221-end)SP1 subdomain averaged over the MD trajectories: CTD–SP1 WT (top) and CTD–SP1(T8I) (bottom). The expanded scale (0–0.05; right hand side) is shown for the “Sheet” content. b, c The CTD tail (V221-end)SP1 region exhibits a dynamic equilibrium between random coil and helical conformations in CA CTD–SP1 WT, whereas in the CA CTD–SP1(T8I) mutant the dynamics are greatly attenuated and the helical content is increased. d Correlation of MAS NMR chemical shifts and SHIFTX2-predicted shifts from the MD trajectory seeded from the X-ray structure (PDB: 5I4T): CTD–SP1 WT (left) and CTD–SP1(T8I) (right). Note the remarkable agreement between the experimental and predicted shifts, indicating that the MD simulations accurately capture the conformational equilibrium in the assembled CA–SP1

