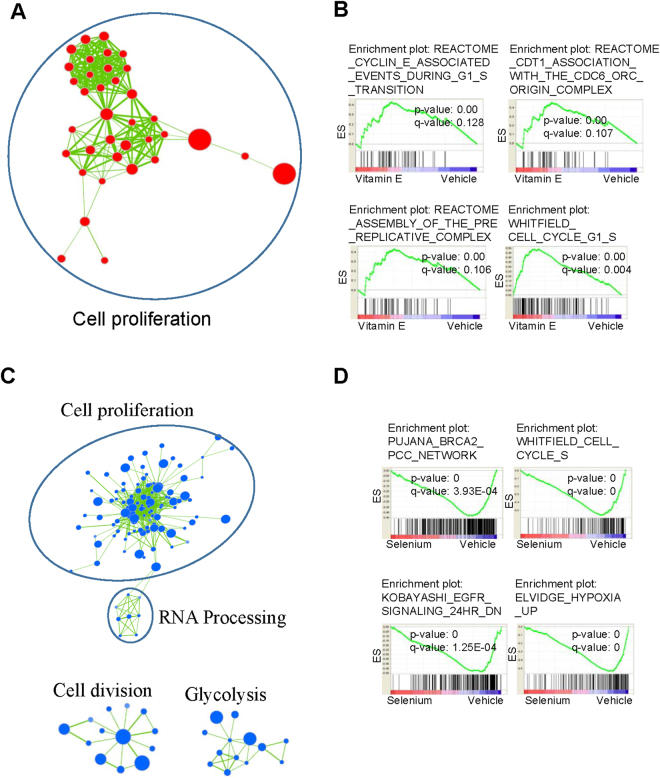
Figure 6.
In RWPE-1 organoids, Vitamin E upregulates a cell proliferation gene network which is suppressed by Selenium. We used Cytoscape to cluster together functionally related gene sets found to be significantly enriched after querying our microarray data with MSigDB’s C2 curated gene sets using GSEA. We show networks containing ≥5 gene sets (False Discovery Rate q value < 0.25). Node size corresponds to gene set size. Red circles represent up-regulation and blue circles represent down-regulation of the gene set. Colour intensity represents significance by enrichment p value. Line thickness connecting the gene set nodes represents the degree of gene overlap between the two sets. (A)Vitamin E upregulated a gene set network associated with cell proliferation (B) Example GSEA enrichment plots for selected gene sets from the Vitamin E network. The Enrichment Score (ES; y-axis) reflects the degree to which a gene set was upregulated (cumulative positive score) or down-regulated (cumulative negative score) in the treatment group. Each vertical line in the ‘bar code’ represents a single gene in a gene set. Hue designates the direction in which the genes are altered (red = enriched in Vitamin E, blue = depleted in Vitamin E). Nominal p value (statistical significance of the enrichment) and the FDR are indicated. (C) Selenium downregulated cell proliferation, glycosis gene networks among others (D) Example GSEA enrichment plots for selected gene sets from the Selenium affected networks.

