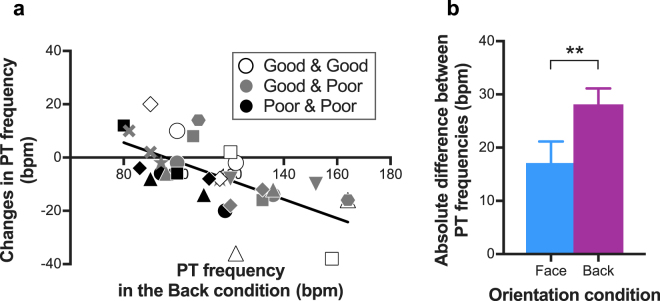
Figure 4.
Correlation between phase transition (PT) frequency in the Back-to-back condition and changes with visual coupling in PT frequency (a) and absolute difference of PT frequencies within a pair (b). In (a), each marker represents an individual participant. The shading designates the type of pair on the variability of auditory-motor coordination. Pairs where both participants were designated as good at coordination with the beat are shown in white. Pairs where both participants were designated as poor at coordination are shown in black. Mixed pairs with a good coordination participant and a poor coordination participant are shown in grey. Shapes represent each pair within each pair type. Thus, two markers whose colour and shape are same indicate paired participants. The trend line represents a linear regression line. In (b), vertical bars represent between-participant standard error.

