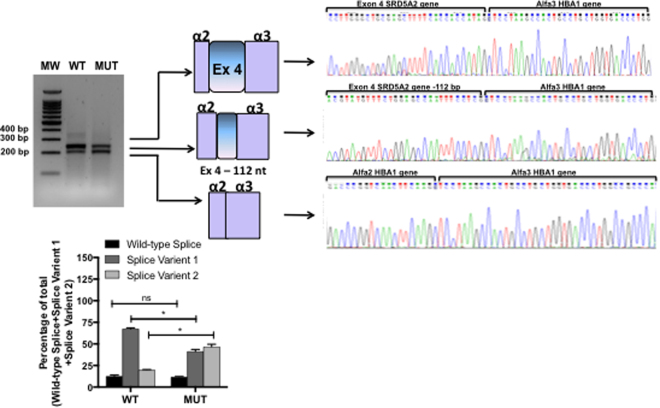
Figure 6.
RT-PCR results from transfection of wild-type SRD5A2 or c.548-44 T > G SRD5A2 minigenes. A representative agarose gel (n = 3) showing the results of RT-PCR of wild-type (WT) and mutant (MUT) minigene splicing is shown and quantified for the accompanying graph. Schematic diagrams identifying the wild-type transcript (369 bp), a transcript with deletion of 112 nucleotides (257 bp), and a third transcript with exon 4 skipping are shown (217 bp). The panel on the right shows electropherograms of cDNA splicing isoforms generated from wild-type and mutant minigenes. The histogram shows the relative percentage expression of each isoform calculated against total intensity of the bands representing each isoform. Student t test analysis shown; *p < 0.01.

