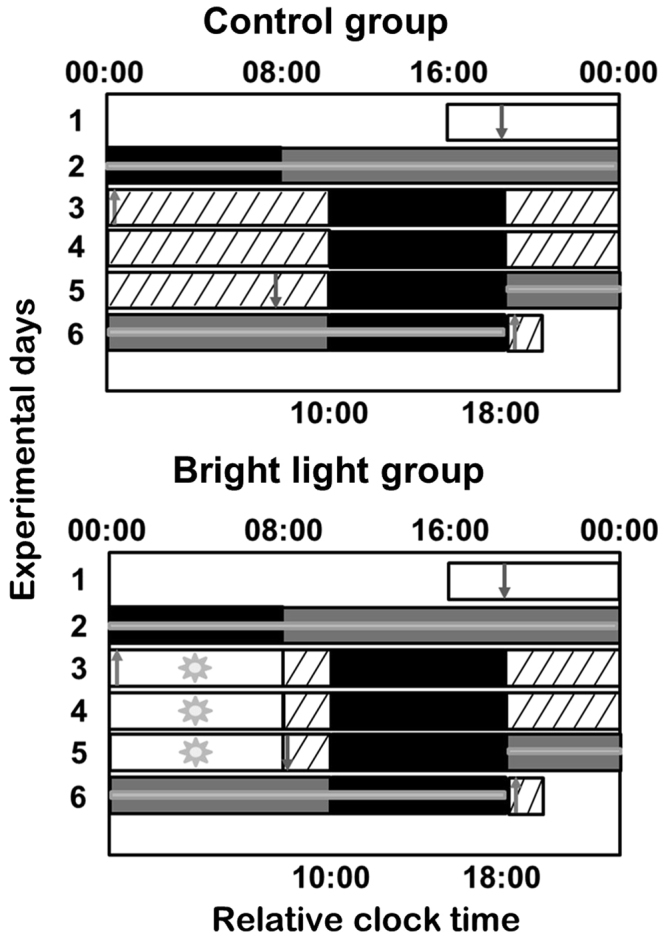
Figure 1.

Experimental protocol. The 6-day experimental protocol is described in the Methods section. Successive experimental days are shown from top to bottom on the y-axis and time-of-day is shown on the x-axis. For analysis purposes, the bedtimes and wake times of each subject were assigned a relative clock time of 00:00 and 08:00, respectively. The black rectangles represent 8-h sleep periods in darkness. The white rectangles represent waking periods during standard days in ~100 lux. The hatched rectangles represent waking periods in dim light (~3 lux). The 8-h bright light exposure is shown as white bars with sun symbols (~6,500 lux). The grey rectangles represent the constant posture (CP) procedure (~3 lux). Blood was collected hourly for 24 h during each 16-h CP procedure and the 8-h sleep period preceding or following CP1 and CP2, respectively, as indicated by grey horizontal lines. Arrows indicate times of catheter insertion (downward arrows) and removal (upward arrows).
