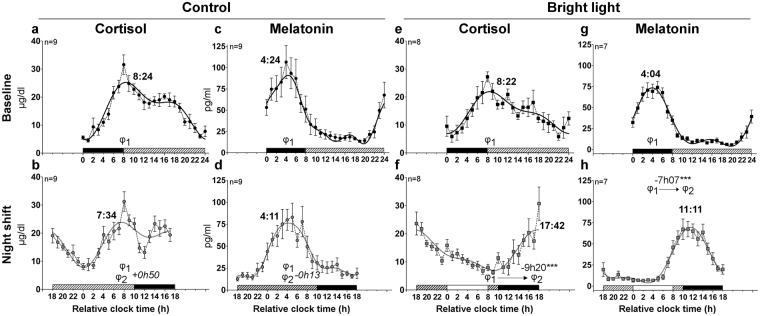
Figure 2.
Circadian rhythms of plasma cortisol and melatonin in baseline and night shift conditions in the control and bright light groups. Mean levels ( ± S.E.M.) and group harmonic regressions of plasma cortisol (µg/dl) (a,b,e,f) and melatonin (pg/ml) (c,d,g,h). Baseline (black symbols) (a,c,e,g) and night shift (grey symbols) (b,d,f,h) conditions are represented by circles for mean levels and by lines for harmonic regressions. At baseline, the bedtimes and wake times were assigned a relative clock time of 0:00 and 8:00, respectively. Above the x-axis, the dashed, white and black bars represent the wake episodes in dim light, the bright light exposure and the sleep episode, respectively. The main phases observed at baseline and night shift conditions are represented by φ1 and φ2, respectively, and are indicated as hours:minutes over the curves. The position of both phases is illustrated (b,d,f,h) allowing a visualization of their difference, along with the value and the statistical significance of the phase shift. ***P < 0.001.

