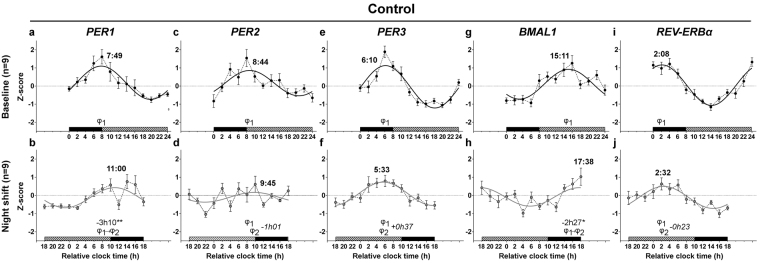
Figure 3.
Circadian rhythms of clock gene mRNA expression in PBMCs in baseline and night shift conditions in the control group. Mean levels (±S.E.M.) and group harmonic regressions of PER1 (a,b), PER2 (c,d), PER3 (e,f), BMAL1 (g,h) and REV-ERBα (i,j) are given as Z-scores. Results are presented for the baseline (a,c,e,g,i) and night shift (b,d,f,h,j) conditions. See the legend of Fig. 2 for details. *P < 0.05; **P < 0.01.

