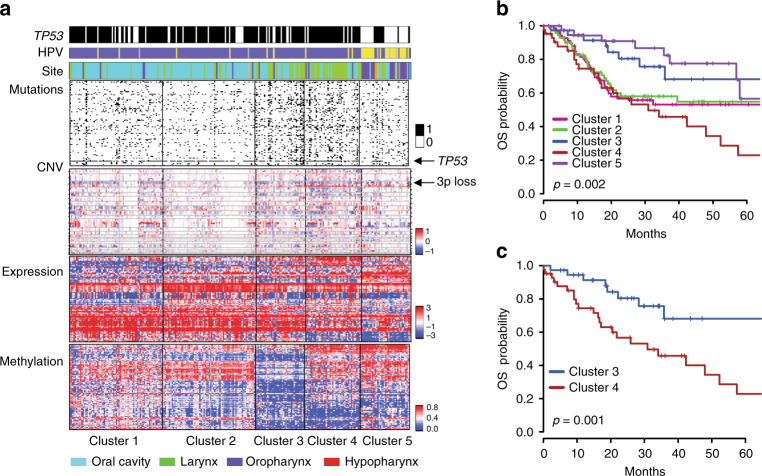
Fig. 1.
Integrative clustering of 256 SCCHN tumors. a The top three rows indicate TP53 mutation (black), HPV status (purple = HPV–; yellow = HPV + ; and gray = unknown), and tumor site. Mutation panels indicate individual mutations in the top 25% most commonly mutated genes; note the marked mutational burden in clusters 3 and 4. CNV indicates the heatmap of chromosomal gains (red) and losses (blue). For gene expression, the heatmap indicates overexpression (red) or underexpression (blue) of genes; specific gene IDs are provided in Supplementary Data 1, and gene ontology (GO)-enriched categories are provided in Supplementary Data 2. For methylation, a heatmap plots β values of the probes as unmethylated (blue) or methylated (red). Genes corresponding to probes and enriched GO categories for methylation are listed in Supplementary Data 1 and 3, respectively. b Kaplan–Meier (KM) overall survival (OS) curves for all clusters identified in a. The p-value (log-rank test) indicates a strong evidence against the null hypothesis that the risk of death is similar across all SCCHN clusters. c. KM OS curves for clusters 3 and 4

