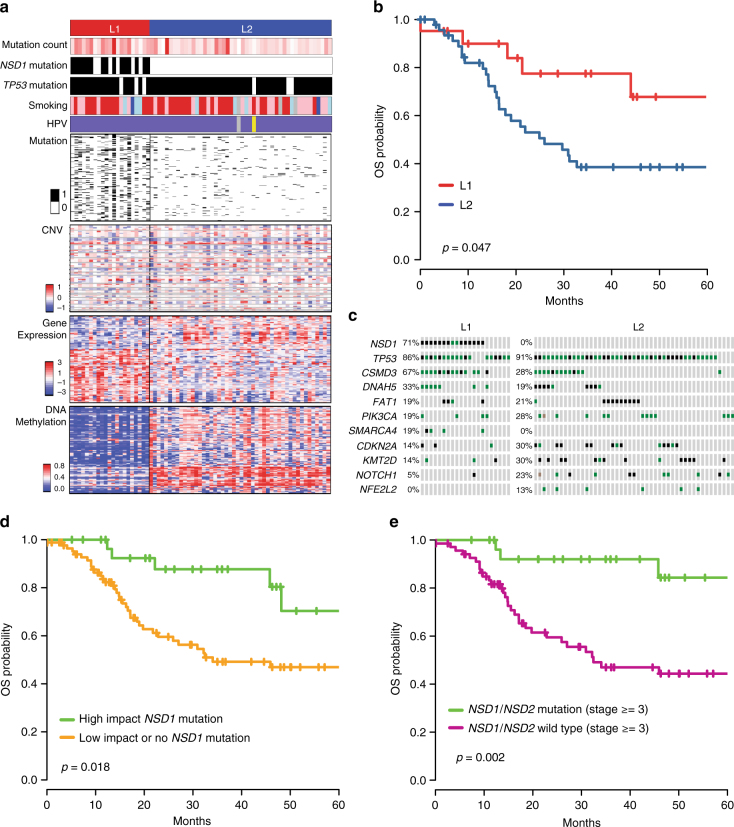
Fig. 2.
Integrative clustering of 69 laryngeal tumors. a The top panel shows larynx L1 (red) and L2 (blue) clusters. Mutation count for each sample is provided as a color gradient. NSD1 and TP53 bars indicate mutations in these genes (black). Smoking status (red = current smoker; pink = former smoker < 15 years; cyan = former smoker > 15 years; blue = lifelong nonsmoker; gray = status unavailable) and HPV status (purple = HPV–; yellow = HPV+; gray = unknown) are indicated. Also see Fig. 1 Legend and Methods. b Kaplan–Meier curves depicting OS of L1 and L2 clusters (p-value from log-rank test). c Mutation grid map of genes commonly mutated in L1 and L2. Each vertical bar represents a patient; black dot = truncating mutation; green = missense mutation. d KM curves for 116 laryngeal samples with NSD1 mutation impact determined by MutationAssessor39, Polyphen, and other function prediction algorithms. e KM curves for higher-stage laryngeal tumors (clinical stage 3 and 4) based on the presence or absence of predicted damaging mutations in NSD1 or NSD2

