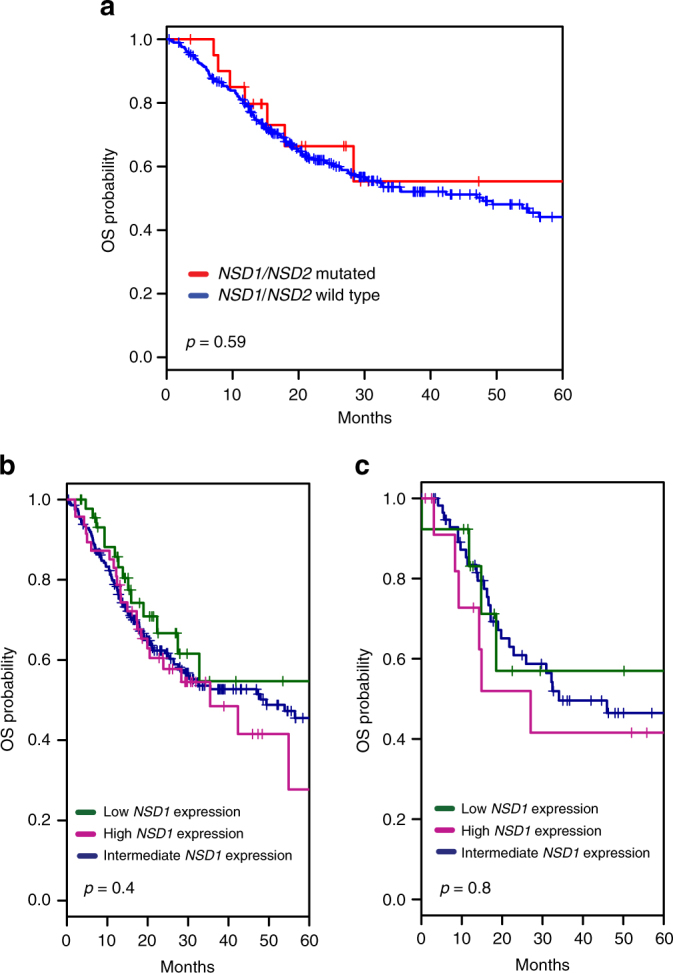
Fig. 3.

Kaplan–Meier curves for overall survival (OS) based on NSD1/NSD2 mutation and NSD1 expression status in nonlaryngeal and laryngeal tumors, based on TCGA data. a Kaplan–Meier curves showing OS for nonlaryngeal HPV– (including oral, oropharynx, and hypopharynx) SCCHN. Red and blue curves show NSD1- and NSD2- mutated, and NSD1/NSD2 wild-type cases, respectively; OS differences are not significant (p-value from log-rank test). b Kaplan–Meier curves showing OS differences for patients with NSD1 wild-type oral cancers trichotomized based on low (< or 15% quantile), intermediate (>15% and <85% quantiles), or high (>85% quantile) NSD1 expression. c Kaplan–Meier curves showing OS for patients with NSD1/NSD2 wild-type laryngeal cancers, with NSD1 expression trichotomized as in b
