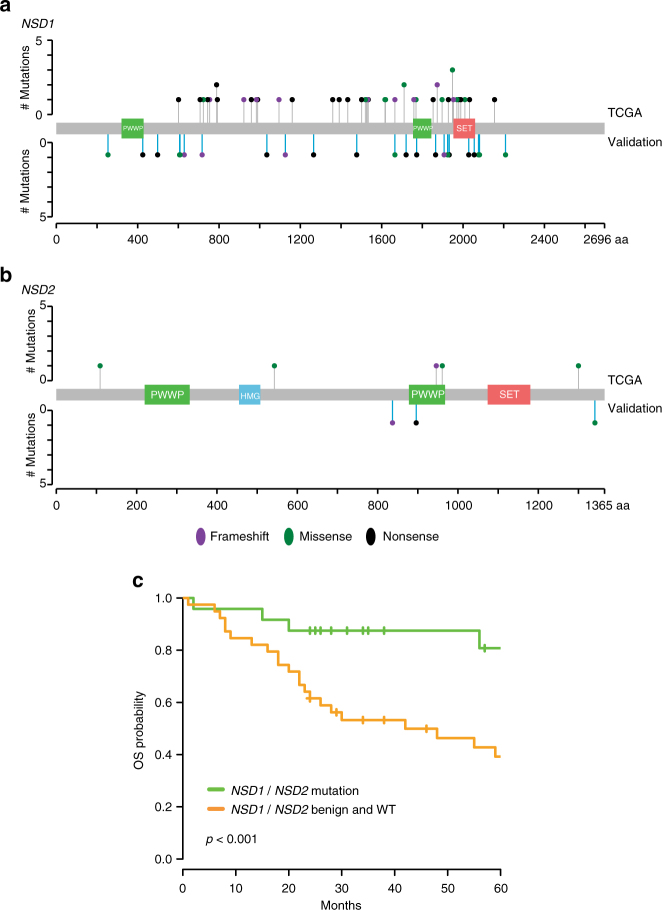
Fig. 4.
Validation of NSD1 and NSD2 mutations in an independent laryngeal cancer cohort. a Plot indicates the location of nonsense (black), frameshift (purple), and missense (green) mutations affecting the NSD1 protein. NSD1 functional domains are indicated. Lollipops above the line indicate mutations reported in the TCGA. Lollipops below the line depict mutations identified in the validation cohort. b Plot similar to a, for NSD2. c Kaplan–Meier curve indicates OS of patients with laryngeal tumors with damaging NSD1 or NSD2 mutation (n = 24) or without such mutations (n = 39), in the validation cohort (p-value from log-rank test)

