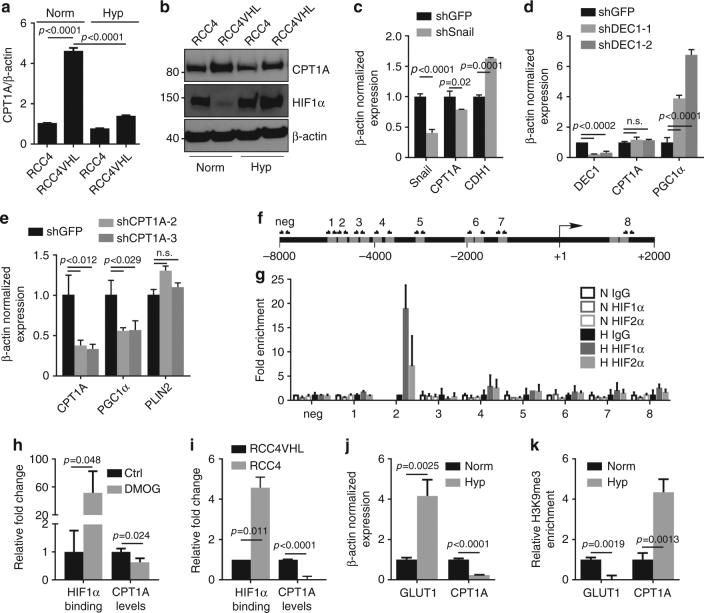
Fig. 5.
HIF1 and HIF2 bind CPT1A and inhibit expression. a mRNA expression of CPT1A in RCC4 and RCC4 VHL cells in normoxia or hypoxia as measured by qRTPCR normalized to β-actin. b Western blot depicting protein expression of CPT1A, HIF1α, and β-actin in RCC4 cells in normoxia or hypoxia for 24 h. c Quantification of the effect of shRNA knockdown of Snail in RCC4 cells on CPT1A and CDH1 (E-cadherin) expression. d Quantification of the effect of shRNA knockdown of DEC1 with two different shRNAs in RCC4 cells on CPT1A and PGC1α expression. e Quantification of the effect of shRNA knockdown of CPT1A in RCC4 cells on PGC1α and PLIN2 expression. f Diagram of the CPT1A promoter region analyzed for putative HREs (gray boxes) 8000 base pairs upstream to 2000 base pairs downstream of the transcriptional start site (+1). Primer pairs used for PCR amplification after ChIP are indicated. g qRTPCR results using primers pairs indicated in f of ChIP with antisera to HIF1α or HIF2α performed on RCC4 VHL chromatin after treating the cells with normoxia (open boxes) or hypoxia (closed boxes) for 24 h. h HIF1α ChIP on the CPT1A region 2 HRE in lysates of RCC4 VHL cells treated with DMOG for 36 h (“HIF1α binding”) compared with CPT1A RT-PCR (“CPT1A levels”). i HIF1α ChIP on the CPT1A region 2 HRE in lysates of normoxic RCC4 and RCC4 VHL cells. j mRNA expression of GLUT1 and CPT1A in RCC4 VHL cells in normoxia or hypoxia as measured by qRTPCR normalized to β-actin. k qRTPCR results of histone H3 lysine 9 trimetylation ChIP on the GLUT1 and CPT1A promoters of RCC4 VHL cells in normoxia or hypoxia. Error bars represent standard deviations. p values of two-tailed Student’s t tests are displayed

