Fig. 6.
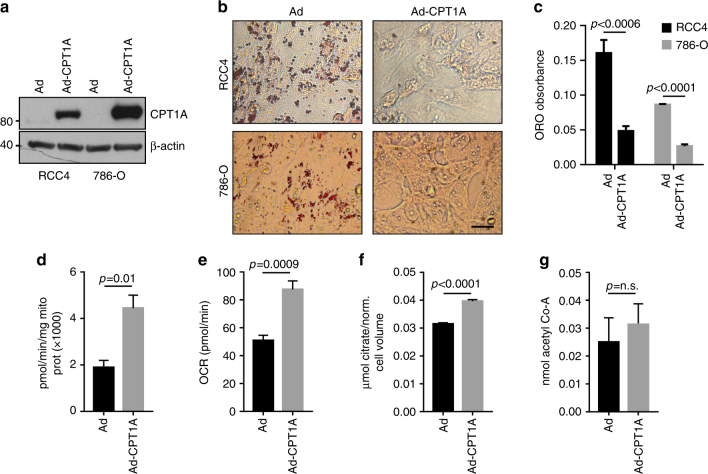
CPT1A expression prevents lipid deposition and alters mitochondrial function in ccRCC cells. a Western blots of RCC4 and 786-O cell lysates after adenoviral infection with CPT1A of GFP-expressing adenovirus stained for CPT1A or β-actin. b Photomicrographs of Oil Red O staining of RCC4 or 786-O cells after infection with GFP or CPT1A adenovirus. Bar = 10 μm. c Quantification of Oil Red O staining depicted in b. d CPT1A activity measurement in adenovirally infected RCC4 cells. e Oxygen consumption rate (OCR) of adenovirally infected RCC4 cells. f Citrate levels in adenovirally infected RCC4 cells. g Acetyl-CoA levels adenovirally infected RCC4 cells. Error bars represent standard deviations. p values of two-tailed Student’s t tests are displayed

