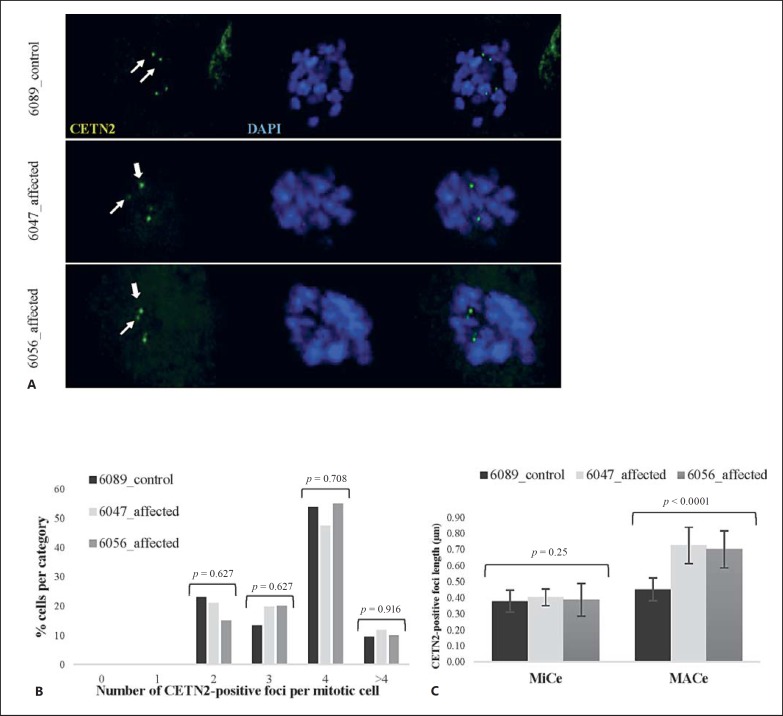
Fig. 3.
Affected fetal amniocytes do not display an aberrant number of CETN2-positive foci in mitosis, but at least one elongated centriole per centrosome. A Confocal images of control and affected mitotic amniocytes stained with anti-CETN2 antibodies (green). Thin arrows represent minor centrioles (MiCes) and thick arrows represent major centrioles (MACes).B Number of CETN2-positive foci in affected versus unaffected mitotic amniocytes. K-proportions test p values are displayed, and nonsignificance was confirmed by the Monte Carlo method for low values (5,000 simulations, p values not shown). C Comparison of average MACe and MiCe lengths in affected versus control amniocytes (MiCe 6089_control = 0.38 ± 0.07 µm; 6047_affected = 0.40 ± 0.05 µm; 6056_affected = 0.39 ± 0.1 µm; MACe 6089_control = 0.45 ± 0.07 µm; 6047_affected = 0.72 ± 0.11 µm; 6056_affected = 0.70 ± 0.12 µm). One-way ANOVA p values are displayed (see online suppl. Table 3 for pairwise comparison tests between control and affected MiCes/MACes singularly).

