Fig. 2.
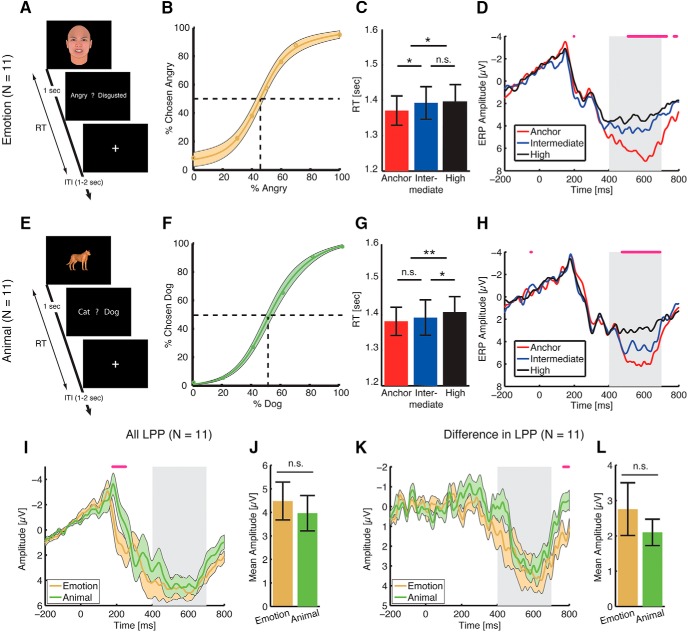
Experiments 2 and 3. A–D, Experiment 2: face judgment task with anger-disgust morphed emotions. E–H, Experiment 3: animal judgment task with cat-dog morphs. A, E, Task. A face (A) or an animal (E) was presented for 1 s followed by a question asking subjects to identify the facial emotion (angry or disgusted; A) or animal category (cat or dog; E). Faces and animals are not shown to scale. B, F, Group average of psychometric curves showing the proportion of trials judged as angry (B) or dog (F) as a function of morph levels. Shaded area denotes ±SEM across subjects. C, G, RT. Subjects judged unambiguous faces (C) or animals (G) faster than ambiguous faces or animals. Error bars denote one SEM across subjects. Paired t test between adjacent levels of ambiguity: *, p < 0.05; **, p < 0.01; n.s., not significant. D, H, ERP at the electrode Pz differentiated ambiguity levels. Both experiments showed a larger LPP for anchors and a smaller LPP for high ambiguity, consistent with the face judgment task with fear-happy morphed emotions. Gray shaded area denotes the LPP interval (400–700 ms after stimulus onset). The top magenta bars illustrate the points with significant difference across three ambiguity levels (one-way repeated-measure ANOVA, p < 0.05, corrected by false discovery rate for Q < 0.05). I, J, Comparison between experiments 2 and 3 on all LPP (average across all conditions). K, L, Comparison between experiments 2 and 3 on the difference in LPP (anchor minus high). I, K, ERP. Shaded areas denote ±SEM across subjects. Gray shaded area denotes the LPP interval. The top magenta bars illustrate the points with significant difference between the two tasks (paired t test, p < 0.05, corrected by false discovery rate for Q < 0.05). There was no significant difference in the LPP between the two tasks for both all LPP (I) and the difference in LPP (K), although the animal task had more negative ERP ∼200 ms for all LPP (I). J, L, Mean LPP amplitude. LPP amplitudes were averaged across the entire interval (400–700 ms after stimulus onset). Error bars denote one SEM across subjects. There was no significant difference between the two tasks for both all LPP (J; paired t test, p = 0.45) and the difference in LPP (L; p = 0.41).

