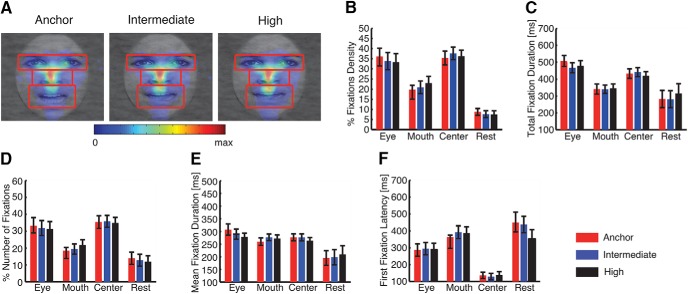
Fig. 5.
Eye movement comparisons across ambiguity levels in experiment 1. A, Fixation density maps to quantify eye movements for each ambiguity level. Each map shows the probability of fixating a given location within a 1-s period after stimulus onset. The scale bar (color bar) is common for all plots (arbitrary units). The ROIs (eye, mouth, center) used for analysis are shown in red (not shown to subjects). B, Percentage of fixation density in each ROI. C, Total fixation duration in each ROI. D, Percentage of the number of fixations in each ROI. E, Average fixation duration in each ROI. F, Latency of the first fixation onto each ROI. Error bars denote one SEM across subjects.

