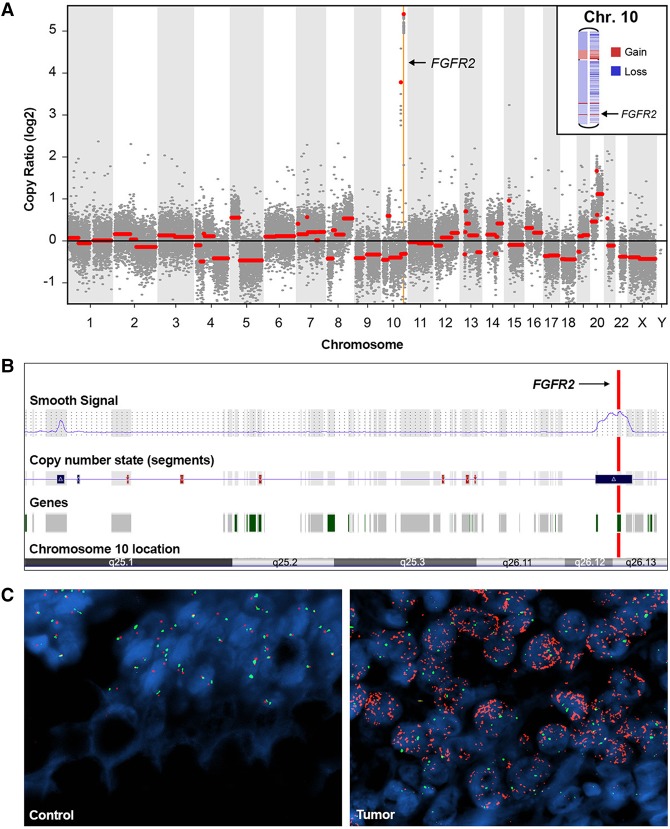
Figure 3.
Multimodal analysis of FGFR2 in the tumor. (A) Targeted NGS-based virtual karyotype (CNVkit) showing background aneuploidy and an amplification event involving a focal region of Chromosome 10 (Chr10:122737302–123454446) that includes FGFR2. (B) Cytoscan microarray output from the tumor tissue revealing amplification of the region involving FGFR2. (C) Fluorescence in situ hybridization of tumor-involved (Tumor) and tumor-uninvolved (Control) colonic tissue from the patient's colectomy. FGFR2 probe (RP11–62L18, red) to Chromosome 10 enumeration probe (CEP 10, green) ratio showing a high copy-number ratio of 24.2 in the tumor (right) versus 1.92 in the control (left).

