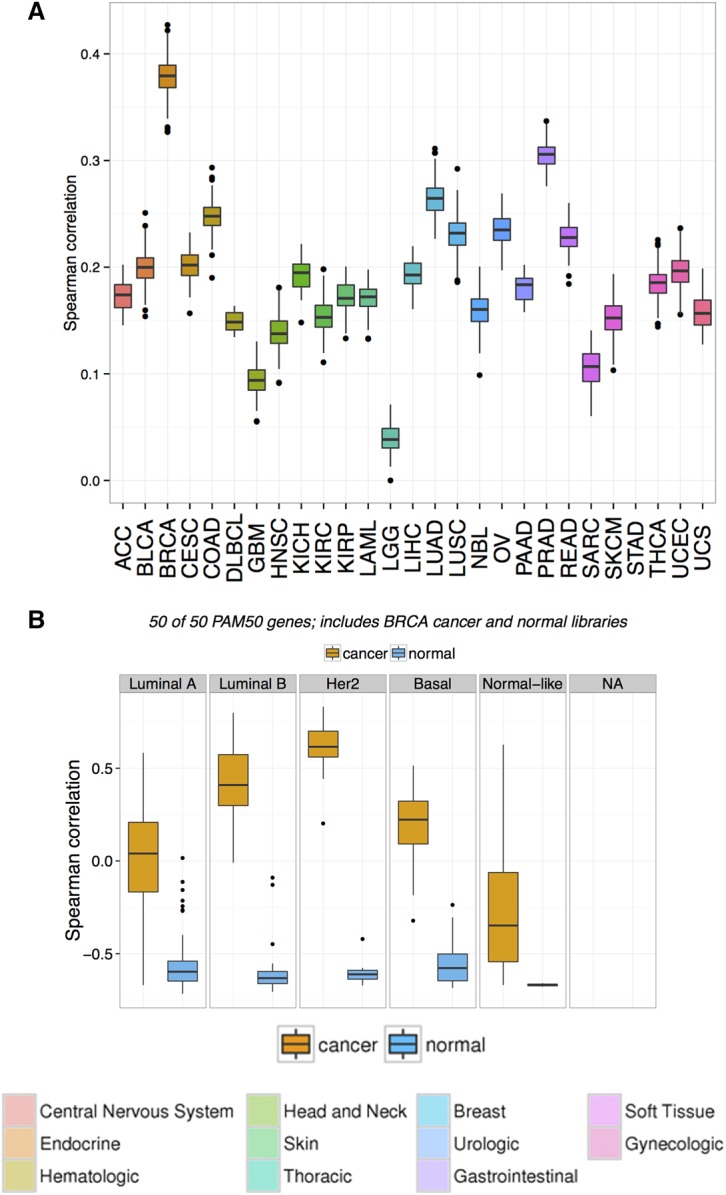
Figure 3.

Correlation plot of the sample with TCGA data sets. (A) Boxplot distribution of the pairwise Spearman correlation of the recurrence biopsy with all TCGA samples, based on 3000 genes selected by ANOVA analysis (see Methods). The x-axis represents cancer types following TCGA conventions for naming. The highest correlation is observed with the TCGA Breast Cancer data set (BRCA). (B) Boxplot distribution of the pairwise Spearman correlation of the recurrence biopsy with the TCGA Breast Cancer data set, based on PAM50 subtypes (see Methods). The pairwise correlations with adjacent normal are shown to exclude any biases from normal contamination. The highest correlation is observed for HER2-enriched type, followed by Luminal B.
