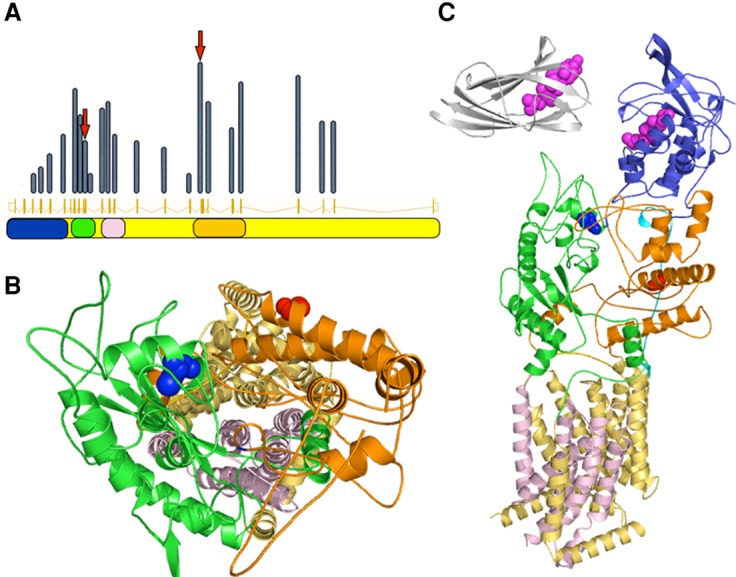
Figure 1.

NPC1 domains are color coded consistently throughout the panels—blue, cholesterol binding domain; green, NPC1-C; orange, NPC1-I, quasi symmetric partner of NPC1-C; pink, sterol sensing domain; yellow, transmembrane region. (A) Relative exonic distribution of previously published NPC1 mutations. Middle row shows the exonic structure, whereas the height of each bar indicates the relative frequency of disease-causing mutations in each exon. Positions of the mutations described in this work are indicated with arrows. The corresponding structural domains are shown in the bottom row. (B) Structural position of the mutated amino acids Cys516 (blue spheres) and Gly910 (red spheres). A top down view of the putative lipid transport channel shows that Cys516 appears to be closer to the inner surface of the channel. The amino-terminal domain is hidden to not obstruct the view. (C) NPC1 protein domains and affected amino acids. NPC2 is also shown on the same scale (silver). Cholesterol molecules are shown in magenta.
