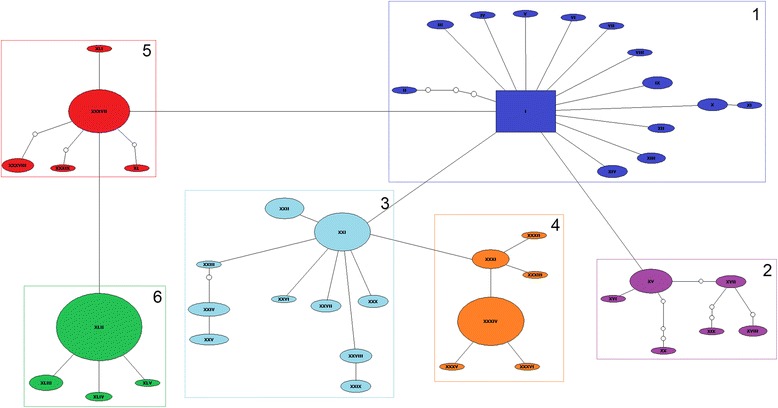
Fig. 1.

Haplotypic network of N. corniger generated through mitochondrial gene 16S rRNA sequencing. Legend: Each line in the network represents a single mutational step. Haplotypes are represented by Roman numerals within the ellipses, with the central haplotype represented by a rectangle. Small circles indicate hypothetical haplotypes that are necessary intermediates among the identified haplotypes, but which were not observed in the sampling. The rectangle in dark blue indicates haplogroup 1, purple = haplogroup 2, light blue = haplogroup 3, orange = haplogroup 4, red = haplogroup 5, and green = haplogroup 6
