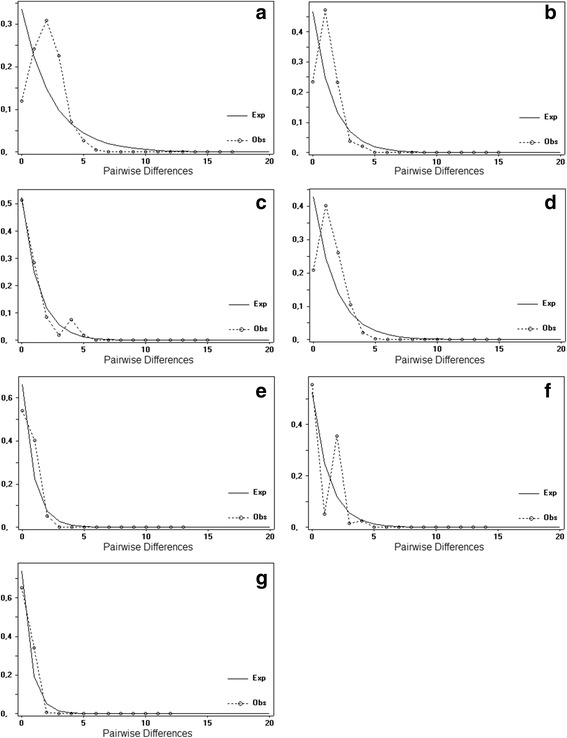
Fig. 2.

Pairwise difference mismatch distribution of the 16S rRNA sequences. Legend: Graph generated a for all N. corniger sampled populations; b-g for Haplogroups 1, 2, 3, 4, 5, and 6, respectively

Pairwise difference mismatch distribution of the 16S rRNA sequences. Legend: Graph generated a for all N. corniger sampled populations; b-g for Haplogroups 1, 2, 3, 4, 5, and 6, respectively