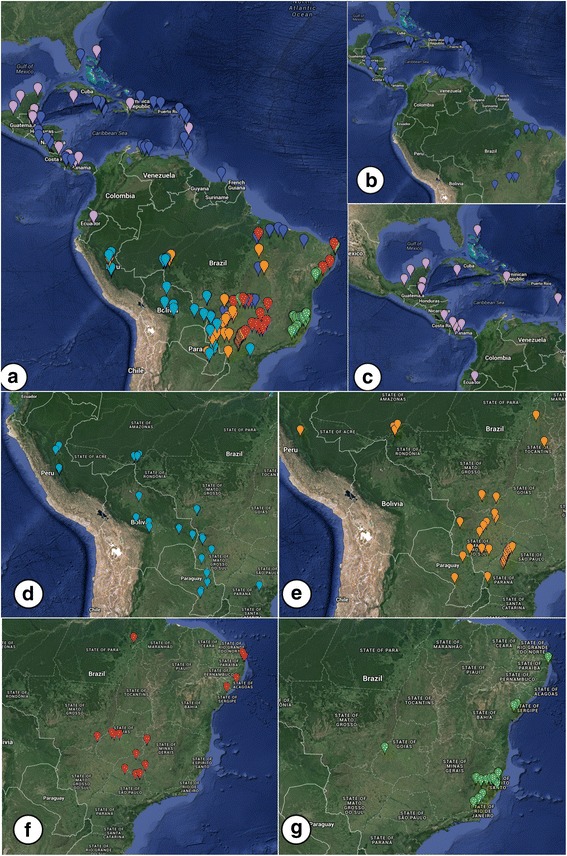
Fig. 3.

Nasutitermes corniger haplotype distribution. Legend: a Haplotypes allocated to their respective locations. The colors of the point markers correspond to the colors of the haplogroups observed in the network (Fig. 1); b-g: locations corresponding to the haplogroups 1, 2, 3, 4, 5, and 6, respectively. Images generated using Google Maps
