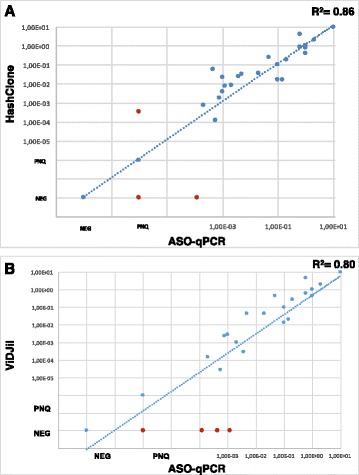
Fig. 4.

Correlation analysis. Scatter plot of the correlation analysis between HashClone and the ASO q-PCR data (Panel a) and between ViDJil and the ASO q-PCR data (Panel b). In Panel a, three discordances (red dots) are detected, one of them is quantifiable only by HashClone. While in Panel b there are four samples quantifiable only by ASO q-PCR. NEG, Negative; PNQ, Positive Not Quantifiable
