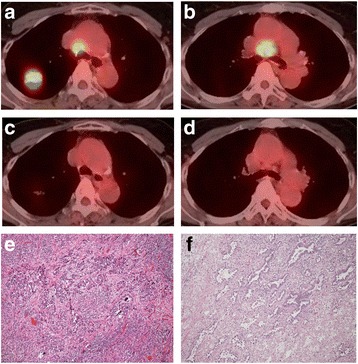
Fig. 1.

Case 1. PET-CT showing the high fluorodeoyglucose (FDG) uptake of the primary lesion and swelling of the #2 (a) and #4 lymph nodes (b) before gefitinib therapy. PET-CT showing the regression of the primary lesion and the #2 (c) and #4 (d) lymph nodes after gefitinib therapy. Histological findings (hematoxylin-eosin staining) showing residual viable tumor cells in the primary lesion (e-f)
