
Fig. 2.
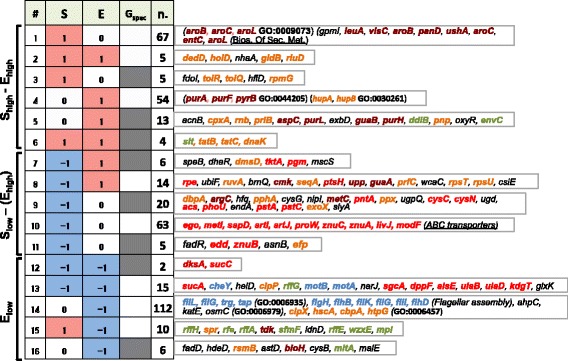
Distribution of genes in 16 phenotypic patterns with significantly (>2 st. dev.) increased (+1/pink) or decreased (−1/cyan) cell size (S), global gene expression (E) and gene-specific effects (G spec ). For each combination of S, E and G spec patterns either the individual extreme genes (for <20 genes) or the functional enrichments (DAVID) of Gene Ontology classes (bold/GO) or KEGG pathways (underscored) is listed. (Text color: brown = amino acids and nucleotides biosynthesis; orange = important to cell growth; red = nutrient uptake and catabolic reactions; cyan = motility and chemotaxis function; dark green = cell membrane structural component) (n.: number of genes; Grey cells: significant G spec phenotype)