
Fig. 3.
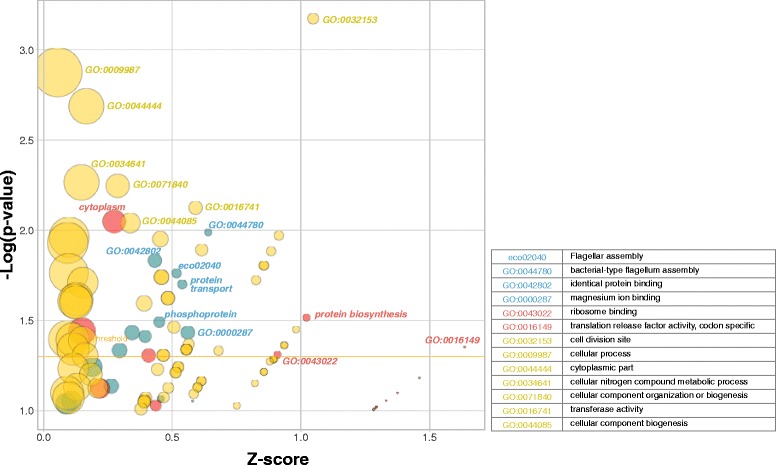
Differential enrichment of GO, KEGG and UP_KEYWORDS functional terms in three groups of genes (Fig. 2): S high and/or E high phenotype (Groups #1–6, yellow circles), predominant S low phenotype (Groups #7–11, red circles) and predominant E low phenotype (Groups #12–16, blue circles). Axes represent enrichment p-value (log10 transform, y-axis) and the enrichment’s z-score (x-axis). Functional terms selected for differential enrichment (legend) have very significant score (>2) or p-value (<0.1), or pass a Log10(p) ≤ 1.3 and z ≥ 0.5 combined threshold