
Figure 3.
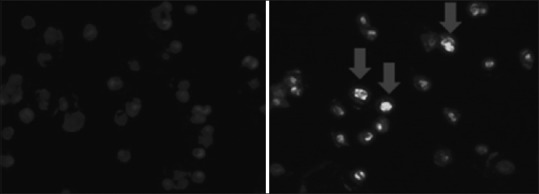
Fluorescence microscopy image. Control (left) and treated (right) cells. Magnification ×40. Arrows indicate cells with pyknosis and karyorrhexis (at column width)
Official websites use .gov
A
.gov website belongs to an official
government organization in the United States.
Secure .gov websites use HTTPS
A lock (
) or https:// means you've safely
connected to the .gov website. Share sensitive
information only on official, secure websites.
Fluorescence microscopy image. Control (left) and treated (right) cells. Magnification ×40. Arrows indicate cells with pyknosis and karyorrhexis (at column width)