Figure 4.

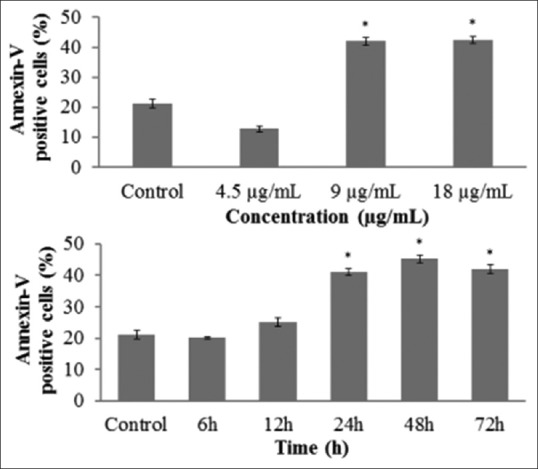
Bar chart corresponds to the annexin-V/fluorescein isothiocyanate assay results. Results shown as percentage mean ± standard error and asterisk as P < 0.05. Top: Dose-dependent study. Bottom: Time-dependent study (at column width)

Bar chart corresponds to the annexin-V/fluorescein isothiocyanate assay results. Results shown as percentage mean ± standard error and asterisk as P < 0.05. Top: Dose-dependent study. Bottom: Time-dependent study (at column width)