
Figure 4.
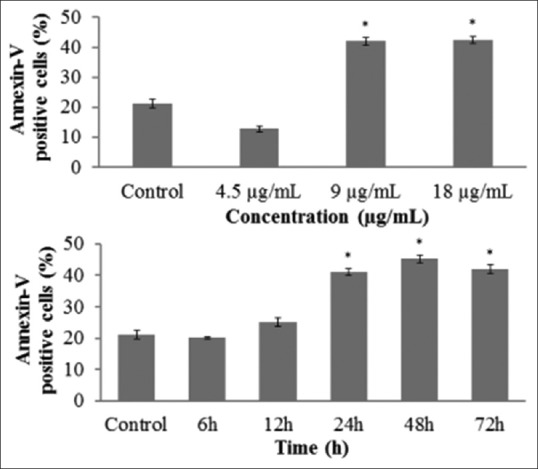
Bar chart corresponds to the annexin-V/fluorescein isothiocyanate assay results. Results shown as percentage mean ± standard error and asterisk as P < 0.05. Top: Dose-dependent study. Bottom: Time-dependent study (at column width)
Official websites use .gov
A
.gov website belongs to an official
government organization in the United States.
Secure .gov websites use HTTPS
A lock (
) or https:// means you've safely
connected to the .gov website. Share sensitive
information only on official, secure websites.
Bar chart corresponds to the annexin-V/fluorescein isothiocyanate assay results. Results shown as percentage mean ± standard error and asterisk as P < 0.05. Top: Dose-dependent study. Bottom: Time-dependent study (at column width)