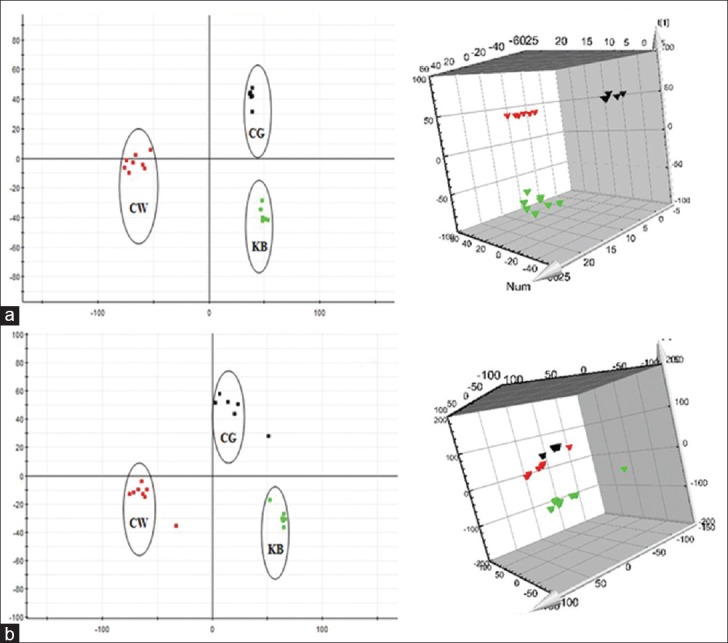
Figure 3.

Principal component analysis score plots of urine samples collected from CW group, CG group and KB group of rats in the 6th month. (a) Electrospray ionization + mode, (b) Electrospray ionization mode ( CW group;
  CG group;
  KB group). KB: Control group
