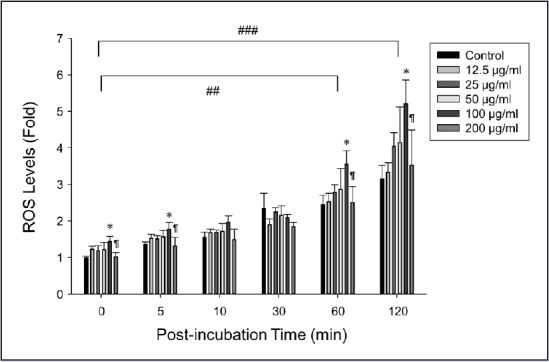
Figure 2.

Effects of FFH on ROS levels in PC-3 cells. Amounts of ROS were determined using DCFH-DA. Results are the mean ± SD of three independent experiments. ##P < 0.01 and ###P < 0.001 vs. 100 μg/mL FFH at baseline (zero) time and *P < 0.05 vs. the nontreated control at each time point. ¶P < 0.05 vs. 100 μg/mL FFH
