
Fig. 1.
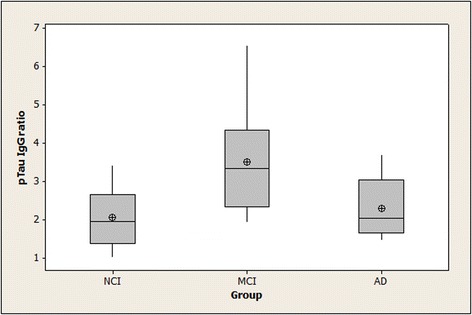
Binding of serum IgG to pTau peptide in NCI, MCI, and AD subjects. Means (circle), medians (line through center of box), upper and lower quartiles (upper and lower borders of box, respectively), most extreme non-outlier values (lines extending from box), and outliers (asterisks) are shown for pTau IgG ratios in serum samples from NCI, MCI, and AD subjects. “pTau IgG ratio” is the ratio of a serum sample’s specific IgG binding to phosphorylated tau peptide-coated wells divided by its specific IgG binding to non-phosphorylated tau peptide-coated wells: ANOVA found evidence of group differences (p = 0.008), with significance at the 0.05 level for the pairwise comparisons between the MCI group and each of the other groups. (NCI = no cognitive impairment; MCI = mild cognitive impairment; AD = Alzheimer’s disease; pTau IgG = specific IgG binding to tau 196-207 phosphorylated at Serine-199 and Serine-202)