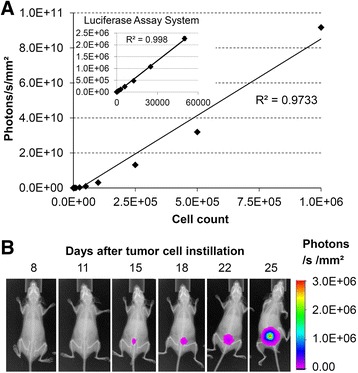
Fig. 1.

Bioluminescence signal intensities of UM-UC-3LUC-K1 cells in vitro in a 96-well plate (a) and in vivo after instillation into the bladder of a SCID-beige mouse from experiment 3 (b) measured using In-Vivo Xtreme imaging system. The insert in (a) shows luciferase signal measured in vitro with the Luciferase Assay System (x-axis: cell count, y-axis: relative light units)
