Figure 4.

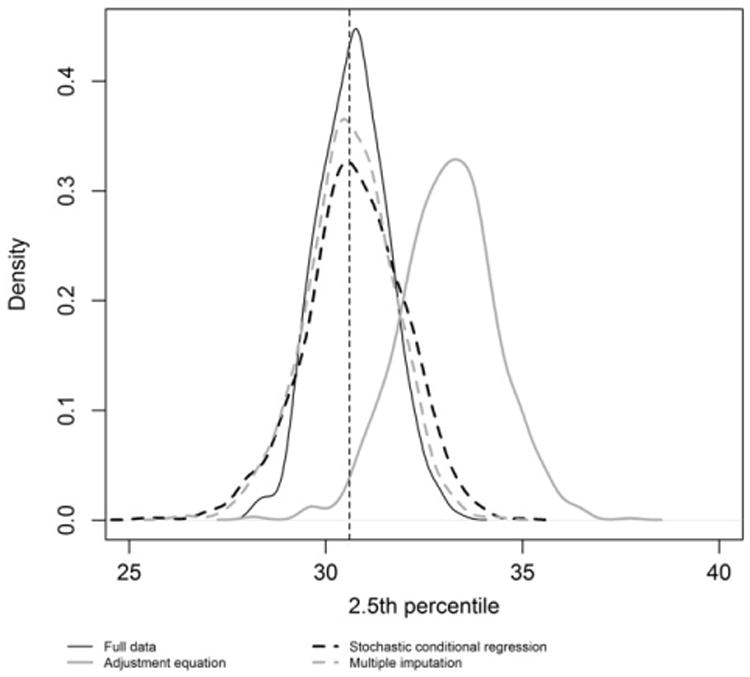
Sampling distribution of the 2.5th percentile based on 1000 simulations under scenario 1 with 90% missing data. The vertical line represents the true value of the parameter (population 2.5th percentile).

Sampling distribution of the 2.5th percentile based on 1000 simulations under scenario 1 with 90% missing data. The vertical line represents the true value of the parameter (population 2.5th percentile).