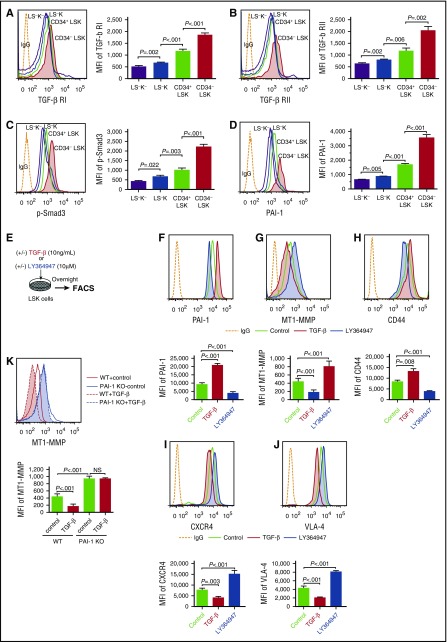
Figure 1.
TGF-β signaling induces PAI-1 expression and controls cell trafficking–related molecules expression in HSPCs. Representative flow cytometric profiles and MFI (n = 6) for TGF-β RI (A), TGF-β RII (B), p-Smad3 (C), and PAI-1 (D) expressions in freshly isolated immature hematopoietic cells. (E) Schema for in vitro experiments. Representative flow cytometric profiles and MFI (n = 6) for PAI-1 (F), MT1-MMP (G and K), CD44 (H), CXCR4 (I), and VLA-4 (J) expressions in WT or PAI-1 KO LSK cells treated with either TGF-β or LY364947 in vitro. Means ± SD are shown in each bar graph. FACS, fluorescence-activated cell sorter; IgG, immunoglobulin G; LSK, Lin−c-kit+Sca-1+; LS−K, Lin−c-kit+Sca-1−; LS−K−, Lin−c-kit−Sca-1−; MFI, mean fluorescence intensity; NS, not significant; RI, receptor I; RII, receptor II.

